


An assessment of performance, value-add and the balance-sheet evidence in English and European football
Written by Paul Quinn / CWTE Limited
Date: 28 July 2026
All balance-sheet figures are stated with their accounting period. Transfer fees are labelled as reported or estimated where not drawn from audited accounts.
Summary
The empirical evidence that Directors of Football add value is real but conditional, and narrower than the industry’s self-promotion implies.
The value-add is overwhelmingly financial, player-trading profit, cost discipline, and organisational continuity, rather than a guaranteed uplift in league points. The single indicator that best separates the two operating models is cumulative profit on disposal of player registrations relative to net transfer spend: the crystallised gap between a squad’s realisable value and its net book value. On this metric, the Director of Football and multi-club-network models are decisively superior; the traditional “all-powerful manager” model is not built to generate it.
Kevin Thelwell added clear financial value at Everton once the counterfactual is properly weighted. Across three years he generated £225m in player sales against £145m of spend across six windows, by his own departure statement. On transfer-record data, Everton’s trading position of roughly +£96.3m since 2022/23 was the best in the Premier League over that window. He cut the wage bill, helped keep the club in the division through two PSR points deductions, and shrank the cost base in a controlled manner. His weaknesses lay on the recruitment-quality side: a thin academy-to-first-team pipeline and several underwhelming purchases. But the sales record and cost control were precisely what a club in PSR distress required.
The balance-sheet signature of good Director of Football work is a widening gap between squad market value and net book value, converted into recurring profit on disposal, and, crucially, the manufacture of near-zero-book-value academy assets whose sale is close to 100% accounting profit. Brighton, Eintracht Frankfurt, Benfica, Lille under Campos, Sevilla under Monchi, and Liverpool under Edwards demonstrate the model at its best; the traditional model tends instead to show impairment charges, destroyed book value, and reliance on one-off asset sales.
The headline conclusion
Adopt the Director of Football model for financial sustainability, not as a guaranteed sporting upgrade. The metric that proves the model is rolling multi-year profit on disposal of player registrations, read alongside the gap between squad market value and net book value. Everything else, net spend, points-per-pound, amortisation ratios, is context.
Empirical evidence of value-add
The scholarly base is real but should not be oversold. Szymanski and Kuypers (Winners and Losers, 1999) established the wage-bill-to-performance relationship that still anchors the field: wages explain the large majority of league-position variance, and transfer spend far less. That finding frames the Director of Football value proposition. The role’s job is largely to improve the efficiency of spend and to generate trading surpluses, not to buy points directly.
The dedicated sporting-director literature is mostly qualitative. Research published in Soccer & Society (2022) documents pervasive role ambiguity: many sporting directors do not sit on the board and therefore lack the authority the role theoretically requires. A 2025 paper in Managing Sport and Leisure frames the modern role as “tri-partite leadership”, effective in dispersed-ownership models. A Scandinavian case study in the same journal (2023) found that structural differentiation, separating sporting and financial logics, reduces institutional tension and improves the balance between sporting ambition and financial sustainability. That is the closest the literature comes to a mechanism for value-add.
Quantitative efficiency work, data-envelopment-analysis studies of the Premier League and LaLiga, and a 2025 Social Science Quarterly study of LaLiga sporting-director signing efficiency, measure club-level efficiency, not the causal effect of the director. The correlation-versus-causation caveat is genuine: clubs that appoint strong Directors of Football are frequently also clubs with disciplined ownership, analytics investment, and coaching stability. Disentangling the director’s marginal contribution from surrounding institutional quality is not currently possible with published data. The honest conclusion is that the evidence supports the model as a driver of financial value-add and sustainability, and is suggestive but not conclusive on a sporting (points) premium.
Key differentiating indicator
If it was necessary to evaluate it as such, which single number best reveals whether a club is running the Director of Football model well versus the traditional model?
Points-per-pound-of-wage and squad-cost ratio are useful but contaminated by owner wealth and revenue base: a state-backed club can post good points-per-pound simply through scale. Net transfer spend is a necessary context but alone is not sufficient, since a low net spend can reflect poverty rather than skill. Amortisation-to-revenue is a good discipline indicator, a rising ratio signals unsustainable front-loading, but is a secondary flag.
The metric that most cleanly separates the models empirically is multi-year profit on disposal of player registrations, together with its balance-sheet source: the gap between squad market value and net book value. This is the metric the Director of Football model is explicitly built to optimise, and the one the traditional model structurally fails to generate. The traditional all-powerful manager buys for immediate sporting need, tends to pay peak-age premiums, and rarely sells assets at the top of their value curve, because managers resist selling their best players.
The Director of Football model buys young and undervalued, develops, and sells at the value peak, systematically converting the market-value-minus-book-value gap into recurring accounting profit.
Key Indicator: Rolling multi-year profit on disposal of player registrations, relative to net transfer spend, the crystallisation of the gap between squad market value and net book value. This is the number that separates structured recruitment models from the traditional manager-led model.
CIES football observatory trading balances
Since January 2021 (Weekly Post 523, November 2025; clubs with material turnover)
| Club | Transfer Revenue | Transfer Expenditure | Net Balance |
| Eintracht Frankfurt | €364m | €78m | +€286m |
| Brighton & Hove Albion | — | — | +€221m |
| VfB Stuttgart | — | — | +€178m |
| Atalanta | — | — | +€150m |
| Benfica | — | — | +€147m |
| Manchester United (bottom) | — | — | -€482m |
Adding the estimated value of players still under contract, Frankfurt lead at +€670m and Real Madrid at +€591m. Analyst-compiled, not audited.
The clubs at the top of the ranking all run structured Director of Football or recruitment-committee models. The club at the bottom is the paradigm case of the incoherent traditional-plus-money hybrid.
Academy development and recruitment
CIES Football Observatory data establish the European academy hierarchy. In the 2025 global ranking of most-productive academies (Weekly Post 518, October 2025, across 49 leagues), Benfica ranked first with a training index of 105.1 and 93 Seixal graduates active professionally, averaging 2,582 minutes each, ahead of Barcelona (index 98.7, 76 graduates) and River Plate (97 graduates, third), with Ajax, Boca Juniors, and Sporting CP inside the top ten.
Per a CIES April 2026 study, Benfica also leads the decade revenue ranking at €589m from academy-graduate transfers. Manchester City is the best-rated English academy. For big-five-league players specifically, Real Madrid and Barcelona lead training-club production, with Ajax historically topping the 31-league table.
The English structural problem is well documented. CIES found the share of club-trained players in Premier League squads fell to a then-record low of 11.7%, down from 13.8% the prior year, and across 31 European top divisions dropped below 20% for the first time since 2009. Study author Raffaele Poli noted clubs are increasingly reluctant to give academy players a chance. Overseas players account for 59.9% of Premier League footballers, the second-highest share in Europe behind Cyprus. The link between Director of Football structures and academy output is therefore indirect: the best academy producers, Benfica, Ajax, Sporting, run integrated technical-director models that treat the academy as a core asset-generation engine rather than a cost centre.
Academy-to-first-team transition and pure-profit logic
The single most important financial insight in the academy analysis is that an academy graduate carries no acquisition cost, so their net book value is zero and the entire sale fee is recorded as profit on disposal. A £100m sale of a purchased player might yield only £50m in profit for PSR purposes; the £100m sale of an academy graduate counts as £100m of pure profit. The fact is that homegrown academy players generate pure profit, while the buying club spreads its cost via amortisation.
Approximately £245m was spent on academy graduates in the days before the June 2024 PSR deadline as clubs exploited exactly this asymmetry, and Chelsea head coach Enzo Maresca has said the rules leave clubs feeling compelled to sell academy players precisely because the fee is booked as pure profit.
Under the incoming Squad Cost Ratio, the effect is amplified by three-year averaging: a £60m academy-graduate sale provides a guaranteed boost of roughly £20m per year to the adjusted revenue base for three consecutive years, while academy operating costs are excluded from the SCR numerator. The framework structurally rewards clubs that develop and sell homegrown talent.
Concrete academy sales illustrate the model. Chelsea’s Cobham academy generated roughly £251.2m from graduate sales over three seasons, with notable examples including Mason Mount (£55m to Manchester United), Ian Maatsen (£37.5m to Aston Villa), Conor Gallagher (circa £34m to Atlético Madrid), and Lewis Hall (£28m to Newcastle), bringing the decade total to around £299m. Manchester City generated circa €385m, with Cole Palmer (circa £40–42.5m to Chelsea) the standout near-100%-profit sale. West Ham’s sale of Declan Rice to Arsenal for £105m in 2023 and Aston Villa’s sale of Jack Grealish to Manchester City for £100m are the largest single English examples.
On transition rates, the picture is that English clubs increasingly sell rather than play academy graduates. The financial incentive, pure-profit sales to satisfy PSR, can actively work against giving graduates first-team minutes at the selling club.
Player trading
Eintracht Frankfurt under Markus Krösche, sporting director since June 2021, is the current benchmark. The club generated €265m in gross revenue from three core striker sales alone: Randal Kolo Muani, signed on a free from Nantes and sold to PSG for €95m; Omar Marmoush, sold to Manchester City for €75m; and Hugo Ekitike, bought for roughly €31.5m and sold to Liverpool for €95m. CIES ranks Frankfurt the most profitable trading club in Europe since 2021 at +€286m. Krösche’s stated philosophy is that Frankfurt is “a club in between”, selling to the end clubs.
Brighton, under Dan Ashworth to 2022 and then David Weir alongside Paul Barber, posted on its audited 2022/23 accounts a £133m pre-tax profit (£122.8m post-tax) on revenue of £204.5m, with profit from player sales near doubling from £62m to £121.4m, the most ever recorded by an English top-flight club at the time. This was driven by Cucurella, Bissouma, Mac Allister, and Trossard, and subsequently Caicedo at roughly £115m to Chelsea. Notably, Brighton’s biggest single sale of the Ashworth era was an academy product, Ben White.
Monchi’s Sevilla (2000–2017 and 2019–2023) generated approximately €200m of career trading profit while funding five Europa League titles, the archetypal buy-short, sell-long, win-trophies model, built on Alves, Rakitic, Kondogbia, Bacca, and Krychowiak. Luís Campos at Monaco and Lille produced spectacular value multiples: Monaco bought Mbappé, Bernardo Silva, Fabinho, Lemar, Mendy, and Bakayoko for a combined circa £42m and sold them for circa £420m; Lille sold Pépé for €80m and replaced him with Osimhen at €22.4m, later sold for €70m. Campos built the only two Ligue 1 titles (Monaco 2017 and Lille 2021) to interrupt PSG’s dominance in the period.
Liverpool under Michael Edwards ran the data-led FSG model: Coutinho sold for a reported £142m including add-ons in January 2018, funding Van Dijk at £75m and Alisson at £67m. The Edwards era is estimated at roughly £550m of spend against £380m of sales, about £170m net, culminating in the 2019 Champions League and the 2020 Premier League title.
Brentford, under Matthew Benham with Phil Giles and Rasmus Ankersen, ran the statistical-modelling variant, famously replacing their traditional academy with a B-team infrastructure and trading Maupay (£1.6m to circa £20m), Watkins (£6.5m to circa £30m), Benrahma, and Toney. Benfica and Porto represent the Portuguese sell-to-survive-and-win model that underpins Benfica’s world-leading academy productivity and its €589m of decade academy-transfer revenue.
Acquisition and disposal success metrics
The most defensible acquisition metric in the literature is minutes played per pound of fee, combined with resale value versus fee paid. Disposal success is best measured by fee achieved versus net book value, and by timing relative to contract length: selling with one to two years remaining maximises the fee while the book value has amortised down, maximising profit on disposal. The Director of Football model optimises both sides of the ledger. The traditional model, by holding players too long and letting contracts run down, systematically destroys disposal value via players lost on frees or sold below their peak.
Balance-sheet values of intangibles vs. cost
Player registrations are capitalised at acquisition cost and amortised straight-line over the contract length under FRS 102 for English clubs. Four signatures reveal Director of Football performance on the balance sheet:
- The value gap: The margin between squad market value (CIES or Transfermarkt estimates) and net book value. A large positive gap indicates value creation through young, appreciating, under-amortised assets; a negative gap or heavy impairment indicates value destruction.
- Profit on disposal: The crystallisation of that gap.
- Impairment charges: Direct evidence of failed recruitment. Brighton, tellingly, took an £8m player impairment in 2021/22 but none in 2022/23, a sign of recruitment quality.
- Amortisation-to-revenue: A forward discipline indicator.
The league-wide context, from previous analysis I published in 2023/24, is that the net book value of player registrations across the Premier League rose 14% to £5.5bn, fifty per cent higher than two seasons earlier. Manchester United’s amortisation rose to roughly £190m by 2023/24 on heavy, front-loaded spend, the balance-sheet signature of the failing traditional-plus-money hybrid, consistent with its CIES-worst trading balance of -€482m.
Everton’s accounts show the opposite signature, the Director of Football under duress: falling amortisation (£95m in 2018/19, £77.6m in 2022/23, £64.6m in 2023/24, £50.9m in 2024/25), a shrinking net book value of player registrations (£144.5m at June 2023, £120.23m at June 2024, £96.9m at June 2025), and recurring profit on disposal used as the primary PSR-compliance lever.
Evidence-based tiering of prominent directors of football
Tiering ranks on audited trading records, trophies delivered against resources, and institutional outcomes.
| Tier | Director | Clubs / Period | Evidence Basis |
| 1 | Txiki Begiristain | Manchester City, 2012–2025 | 21 major trophies incl. 7 Premier League titles and the 2023 Champions League; coherence of recruitment and managerial continuity. Succeeded by Hugo Viana (2025). |
| 1 | Michael Edwards | Liverpool (now FSG CEO of Football) | Data-led model; c. £170m net spend delivering CL 2019 and PL 2020; returned 2024 with Richard Hughes as sporting director. |
| 1 | Markus Krösche | Eintracht Frankfurt, 2021– | CIES-ranked most profitable trader in Europe since 2021 (+€286m); Europa League 2022; robust revenue from high-profile striker sales. |
| 1 | Monchi | Sevilla (2000–17, 2019–23) | c. €200m career trading profit; 5 Europa League titles. Weaker records at Roma and Aston Villa show context-dependence. |
| 1 | Luís Campos | Monaco, Lille, PSG | Two Ligue 1 titles against PSG; Monaco c. £42m in / c. £420m out; role in PSG’s 2024/25 CL squad build; contracted to 2030. |
| 2 | Cristiano Giuntoli | Napoli, Juventus | Architect of Napoli’s 2023 Scudetto (Osimhen, Kvaratskhelia at €11.5m, Kim Min-jae); materially weaker Juventus record. |
| 2 | Dan Ashworth | Brighton, FA, Newcastle, Man Utd | Genuine value at Brighton and the FA; CL qualification at Newcastle; five-month Man Utd tenure at c. £4.1m exit cost. |
| 2 | David Weir | Brighton | Continuity of the Brighton trading model post-Ashworth, incl. the record £121.4m player-sale profit year. |
| 2 | Simon Rolfes | Bayer Leverkusen | Oversaw the invincible 2023/24 Bundesliga and DFB-Pokal double squad. |
| 2 | Giovanni Sartori | Atalanta, Bologna | Atalanta’s trading excellence; Bologna’s Champions League qualification. |
| 2 | Andrea Berta | Atlético Madrid | Long, successful Atlético tenure establishing the club as a modern European force. |
| 2 | Kevin Thelwell | Wolves, NY Red Bulls, Everton, Rangers | Best-in-league trading balance under PSR duress at Everton; recruitment quality mixed. |
| 3 | Paul Mitchell | Southampton, RB Leipzig, Monaco, Newcastle | Prominent, itinerant, contested record. |
| 3 | Others | Steidten; Mislintat; Rangnick; Tare; Deco; Wilcox / Garlick | Prominent but contested or early: Mislintat strong at Dortmund, mixed-to-poor since; Rangnick the intellectual godfather of the Red Bull model; Wilcox and Garlick current at Man Utd. |
Kevin Thelwell at Everton (February 2022 to Summer 2025)
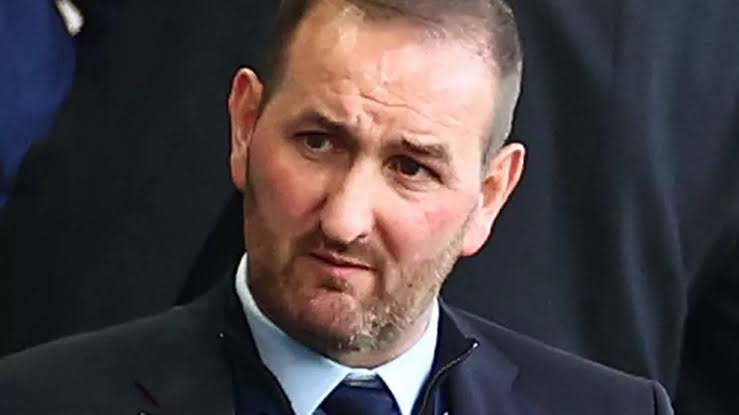
Thelwell was appointed Everton’s Director of Football on 25 February 2022, arriving from New York Red Bulls with a prior background as Wolves’ academy manager and head of recruitment.
He inherited the wreckage of Farhad Moshiri’s spending: Everton posted a statutory loss in seven of eight complete Moshiri financial years. During his tenure, the club suffered two PSR points deductions in 2023/24, an initial ten points (reduced to six on appeal) for the period to 2021/22, and a further two points for the period to 2022/23 for a £16.6m breach of the £105m threshold. It fought a stadium-construction financing squeeze, endured repeated relegation battles under Frank Lampard and then Sean Dyche, a protracted takeover saga, and finally the Friedkin Group takeover completing on 18 December 2024.
The correct analytical lens is therefore the counterfactual: Thelwell was recruiting with minimal-to-negative net spend under acute PSR duress.
Trading Record
Thelwell’s own departure statement of March 2025 is the primary source: “Whilst we have received £225m in player sales over the last three years, our circumstances have only allowed us to spend £145m across six transfer windows.” Everton executive chairman Marc Watts credited him with ensuring Premier League survival by resolving PSR issues through significant player trading.
On transfer-record data, since 2022/23 Everton paid £173.8m in fees and received £270.1m, a net positive of about £96.3m, the best position in the Premier League over that window, with only Burnley running a comparably low net spend.
Thelwell-era transfer windows
Reported fees; add-ons noted where known. Read as best-available estimates rather than statutory numbers.
| Window | Spent | Received | Net Balance | Principal Deals |
| Summer 2022 | c. £83.1m | c. £58m | -£25.1m | In: Onana £33m base (£39m incl. add-ons), McNeil £17m, Maupay £11.8m, Garner £10.4m; Tarkowski free, Coady loan. Out: Richarlison to Spurs, £50m + £10m add-ons. |
| January 2023 | nil | c. £45.6m | +£45.6m | Out: Anthony Gordon to Newcastle, £40m + £5m add-ons. |
| Summer 2023 | c. £40.5m | c. £82.8m | +£42.3m | In: Beto c. £25.75m, Chermiti; Danjuma and Harrison loans. Out: Kean, Iwobi to Fulham, Gray. |
| January 2024 | nil | nil | nil | No material activity. |
| Summer 2024 | c. £50.2m | c. £83.7m | +£33.5m | In: O’Brien £19.5m, Ndiaye c. £15–18m, Iroegbunam £9–10.7m. Out: Onana to Villa £50m (£59.4m incl. add-ons), Godfrey c. £12m, Dobbin c. £9m. |
| January 2025 | nil | minor | nil | No material structural changes; squad stabilized for final run. |
The strongest buys on a value basis were Amadou Onana (bought for a £33m base fee in 2022 and sold to Aston Villa for £50m in 2024, netting a PSR profit of roughly £28–30m against an amortised book value of about £20–22m) and Iliman Ndiaye, widely rated the best of the later signings. James Garner and Jake O’Brien served as durable squad assets, while Dwight McNeil and the free transfer of James Tarkowski proved to be highly dependable.
The weaker end of the ledger comprises Neal Maupay (who delivered a minimal return before a modest book-profit sale to Marseille), Beto (circa £25.75m, inconsistent), Youssef Chermiti (later moved to Rangers for around £7m), and several loans including Danjuma, Lindstrøm, and Alcaraz. Free and experienced additions in Tarkowski, Ashley Young, and the returning Idrissa Gueye provided cheap stability.
Assessment of sales
The sales side is where Thelwell excelled, and where the academy’s pure-profit logic proved decisive. Anthony Gordon, an Everton academy graduate who joined at eleven, sold to Newcastle for £45m in January 2023, was near-100% accounting profit and Everton’s single most important PSR lever that year. Everton also retained a 15% sell-on clause, which added value on Gordon’s subsequent move to Barcelona. Lewis Dobbin, another academy graduate, went to Aston Villa for circa £9m in June 2024 just before the PSR deadline, again, near-pure profit with a 10% sell-on retained. Richarlison at £60m including add-ons in 2022 and Onana at £50m in 2024 crystallised strong profits on disposal against partially amortised book values.
Jarrad Branthwaite was signed from Carlisle United in January 2020 for roughly £1m. His sale would therefore carry a small book value and would not be pure profit. He became a first-team regular, starting 35 of 38 league games in 2023/24. Everton rejected Manchester United bids in summer 2024 rising to a reported £45m fixed plus £5m in add-ons, valuing him internally at £70–80m. Retaining Branthwaite while hitting PSR compliance through the Gordon, Dobbin, and Onana sales was a defensible strategic choice, not an omission.
Balance-sheet movement across the tenure
Everton: player-registration balance-sheet indicators, audited accounts, years to 30 June
| Indicator | 2022/23 | 2023/24 | 2024/25 |
| Net book value of player registrations (at year end) | £144.5m | £120.23m | £96.9m |
| Amortisation of player registrations | £77.6m | £64.6m | £50.9m (club) / £89.7m (group) |
| Profit on disposal of player registrations | — | £48.5m | £31.3m |
| Wages-to-turnover ratio | 92% | 84% | — |
| Reported loss | £89.1m | £53.2m | — |
For context, amortisation stood at £95m in 2018/19. Post-Friedkin, the 2024/25 accounts show total debt cut from over £1bn to £469m and net assets of £393m (£219.1m at group level).
The pattern, falling amortisation, a shrinking but higher-quality registration base, and recurring profit on disposal, is the signature of a deliberately lower-cost squad architecture assembled under tight regulatory constraints.
Academy integration: a weak spot
The first-team academy pipeline under Thelwell remained thin. Harrison Armstrong, who debuted in August 2024 and made six first-team appearances in 2024/25 before signing a new contract to 2028, is the standout genuine breakthrough; Tom Cannon, Lewis Warrington, and others featured marginally before being sold or loaned. Thelwell’s model relied on selling academy value (Gordon, Dobbin) rather than integrating it long-term. While entirely rational under severe PSR pressure, it represents a genuine structural limitation of his tenure.
Final verdict
Given the immense constraints, negative-to-minimal net spend, two points deductions, a wage bill to cut, an ownership vacuum, and a stadium to finish, Thelwell added clear, measurable value on the exact criteria that determined Everton’s survival: player-trading profit, cost discipline, and squad stabilisation.
He is not a Tier 1 recruitment visionary; several purchases underwhelmed and the academy-to-first-team record was poor. But the counterfactual, a traditional manager-led model attempting the same PSR tightrope, would almost certainly have failed.
On the empirical evidence, he sits firmly in Tier 2 of English Directors of Football: an excellent trader and cost manager operating in exceptional adversity.
Thelwell moved to Rangers as Sporting Director in summer 2025 amid the 49ers Enterprises and Cavenagh takeover, an appropriate next step for his profile. Early evidence from that role is too limited to assess.
For a club deciding whether and how to run the Director of Football model, five clear conclusions emerge:
-
Adopt the model for financial sustainability, not as a guaranteed sporting upgrade: The evidence supports value-add primarily in trading profit, cost discipline, and continuity. Even resource-rich clubs benefit from coherence (City under Begiristain) over incoherence (United).
-
Give the director board-level authority: The academic evidence on role ambiguity is unambiguous, and the Ashworth-at-United case—five months at a circa £4.1m exit cost—is the cautionary tale of a strong operator without structural institutional alignment.
-
Track the right metric: Make rolling three-year profit on disposal of player registrations, and the squad-market-value-minus-net-book-value gap, the headline board KPI, using amortisation-to-revenue and impairment charges as early-warning flags.
-
Treat the academy as an asset-generation engine: Under the Squad Cost Ratio, academy graduates are the single most valuable financial instrument a club owns due to their zero book value, pure-profit sales, and excluded operating costs. The failure mode is selling graduates without ever playing them.
-
On Thelwell specifically: His profile as an elite trader and cost manager suited Rangers’ stated needs. The benchmark that will confirm the appointment is a positive multi-year trading balance combined with domestic title contention within two seasons; the benchmark that would call it into question is a repeat of the recruitment-quality weakness without the valid excuse of PSR duress.
Three developments would change these conclusions: publication of a credible causal study isolating a points premium from the Director of Football role (upgrading the sporting case); a sustained run of model clubs suffering impairment-heavy, loss-making trading (questioning the financial case); and Thelwell’s Rangers record over 2025–2027.
Caveats
Transfer fees are frequently misreported. Wherever possible this report uses club statements, audited accounts, and reliable reporting; many fees are reported ranges and are labelled as such. Add-on structures mean a single headline fee is often misleading. Balance-sheet figures are drawn from audited accounts, and every figure is stated with its accounting period. Group-level figures differ from club-level figures because of fair-value uplift on acquisitions and negative-goodwill treatment.
Causation versus correlation remains the central methodological limitation. The marginal causal contribution of a Director of Football cannot be cleanly isolated from surrounding institutional quality with published data. Claims of value-add in this report are therefore financial and structural, not claims of a proven causal points premium.
Analyst-compiled figures (CIES trading balances, Swiss Ramble estimates) are transparent but not audited; they should be treated as best-available estimates. The report reflects information available as of July 2026.